

Matlab for Signal Processing- Lesson 04
- Grigoris Athanasiadis
- 25 Οκτ 2017
- διαβάστηκε 1 λεπτά

PLOTTING AND GRAPHING
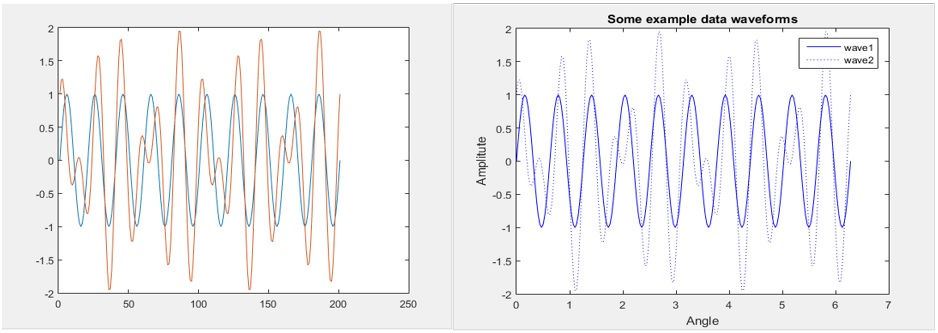
Let's now create a signal
x= 0 : pi/100 : 2*pi
This is a sinusoid signal that starts from 0 with pace pi/100 until 2*pi
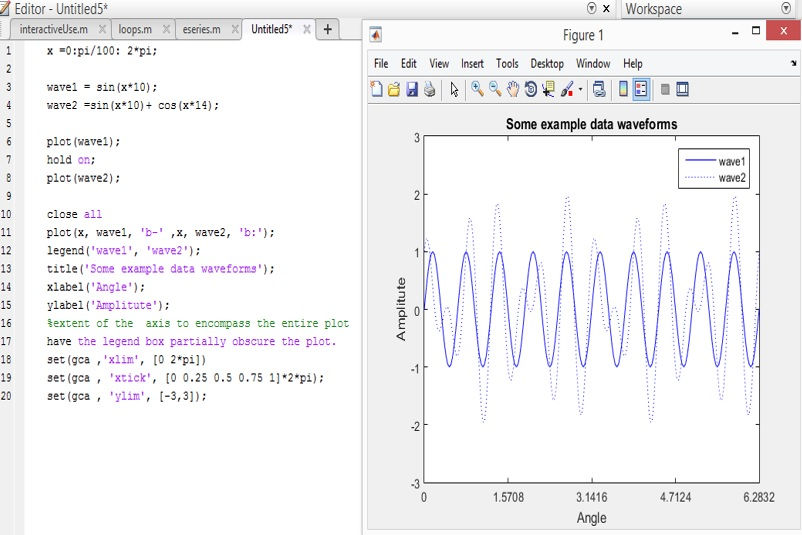
wave1 =sin(x*10);
wave2 =sin(x*10)+ cos(x*14);
We can plot the signals with the command plot but we can plot them together and at the same time we can add a title and declare the x or y axis.


Σχόλια